The full method included: PDF guide and live-market videos
Premium support that answers fast
Platform
TradingView, even the free plan
Markets
Futures, Forex, indices, crypto
Trial
3 days free
Setup
1 minute, no code
What you get out of it
Less time in front of the charts, more clarity when you are there.
01
No more flipping between timeframes
The 4-hour or daily bias sits right on your execution chart. You stay on your 1 or 5-minute chart, without opening three tabs to know which way to look.
02
No more levels to draw every morning
Previous day and week highs and lows, pivots, 15m and 1h FVGs: the indicator watches all of that liquidity for you, continuously.
03
No need to stare at the screen
A TradingView alert reaches your phone as soon as a signal prints. You come back to the chart when something is actually happening.
04
A setup you read at a glance
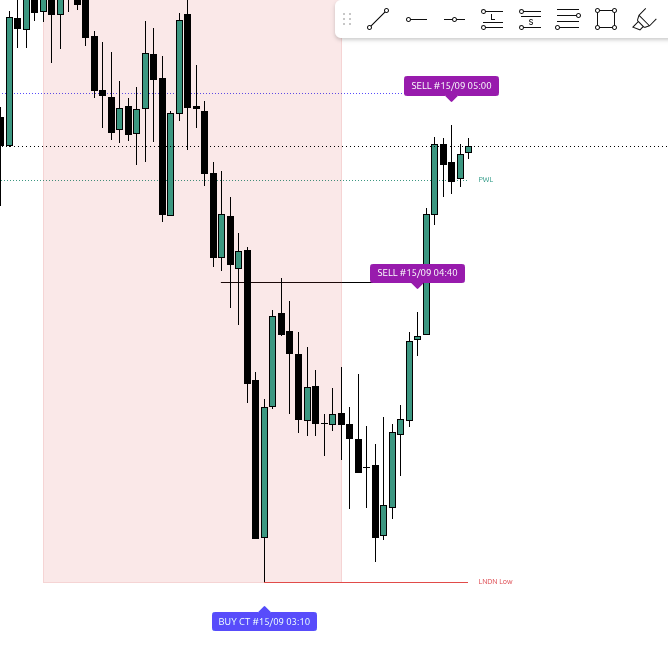
A BUY or SELL label at the sweep. Hover it: the tooltip tells you which liquidity was taken, and where. You know exactly what you are looking at.
The indicator brings you the setup. It places no orders and does not trade for you: what comes next stays in your hands.
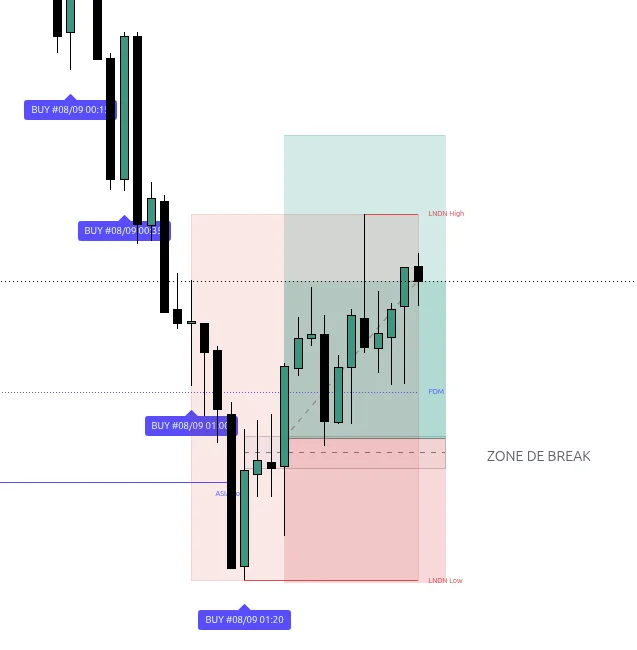
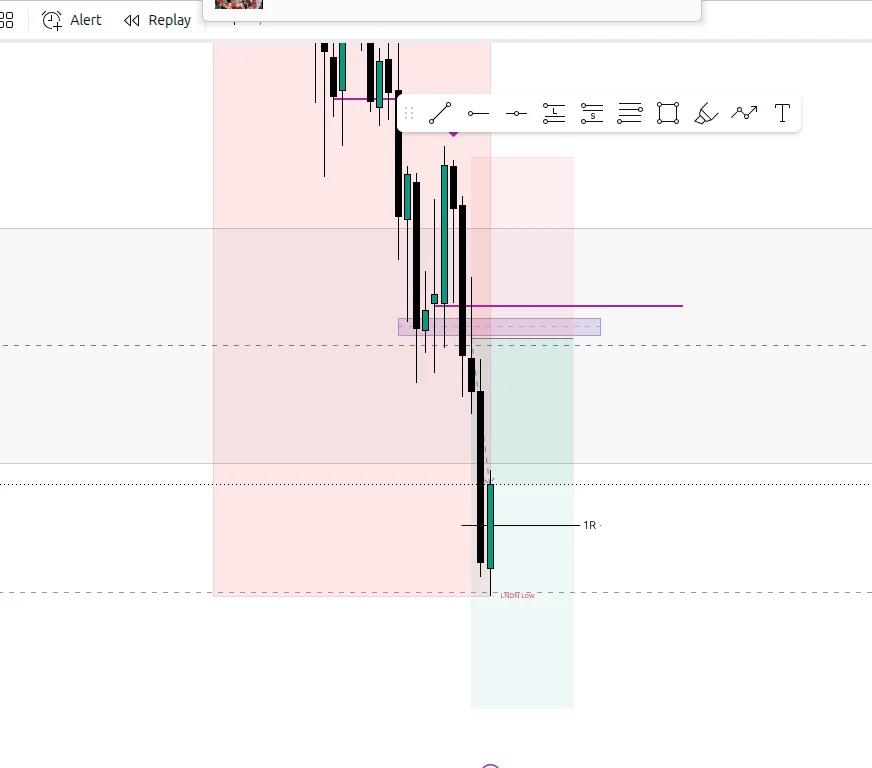
Screenshots from my own chart, untouched. What you see here is what you get on yours.
BUY signals appear around the liquidity sweep. The “break zone” and position plan are manual annotations: they show the validation work that remains with the trader.A bearish example after the indicator signal. The position box, management levels and visible annotations were drawn manually in TradingView.
Commented demonstrations
The strategy, in real market conditions
These three sequences show the complete process: waiting for the break, accepting a planned stop, re-entering only after a new confirmation and recognising a missed entry.
Commented tutorial · 2 min 51
From signal to TP — and a missed trade
The first signals remain invalid without a break. The next setup quickly reaches its TP. Later, our limit order is not filled: a market entry would have reached the target, but the trade remains missed in our actual execution.
Accelerated live trade · 41 sec
A valid setup can still end at the SL
Confirmation is present and the plan is followed, yet the market invalidates the scenario. The stop is hit and the loss remains limited to the risk defined before entry.
Accelerated live trade · 33 sec
After the SL: re-entry, then TP
There is no immediate revenge trade: a new confirmation appears, the trade is taken again under the same rules and this time the move reaches the take profit.
Real educational examples: a TP, an SL or a missed trade does not guarantee future results. The method frames the decision and the risk; it does not remove uncertainty.
Leave your address to hear about new versions of FTS Liquidity Sweep Pro, what they change, and the access terms when they move. A few emails a year, no more.
Frequently asked questions
Before installing the indicator
It first sets a bias from an ICT market structure shift (MSS), on the 4-hour or the daily, your choice. It then keeps a weighted register of liquidity: local and 15m pivots, 15m and 1h FVGs, daily and weekly levels. When one of them is swept and rejected, it places a BUY or SELL signal, then draws the level whose close beyond it would confirm the reversal. Counter-trend signals are kept for major liquidity and marked “CT”.
Higher-timeframe readings use closed candles, and alerts trigger only when the current candle closes. They are therefore not fired by a still-forming wick that might disappear seconds later. An invalidated signal may remain visible on the chart so the context can still be reviewed.
It works on sufficiently liquid markets with a clean TradingView chart. It is used notably on Nasdaq futures (NQ and MNQ), gold, Forex pairs such as EURUSD, and other liquid indices or cryptocurrencies. It is best to begin with one market you already know well.
The logic works across timeframes. One-minute, five-minute and fifteen-minute charts suit intraday monitoring; higher timeframes produce fewer signals and leave more time to analyse. The reference structure can be set to four-hour or daily.
No paid plan is required to add and use the indicator. TradingView’s general limits, including the number of simultaneous alerts, still depend on the plan attached to your account.
Yes. BUY and SELL signals follow the liquidity read. A counter-trend signal carries the “CT” label and is only allowed after major liquidity has been taken. A setting lets you keep signals in the bias or display counter-trend setups only.
Yes. A single TradingView alert using the “Any alert() function call” condition is enough. It fires on every signal, and a setting turns it off. The message includes the market, timeframe, direction and indicator version.
After you sign up on Whop, give your TradingView username. Once the invitation has been added, open TradingView, then “Indicators”, “Invite-only scripts” and select FTS Liquidity Sweep Pro. No Pine code needs to be copied.
Many indicators stop at drawing one zone or isolated concept. Liquidity Sweep Pro combines the reference structure, a weighted liquidity register, rejection, BUY, SELL and CT signals, the confirmation level and alerts. It brings the monitoring work together without turning a signal into a trading order.
Disclaimer. This indicator is an analysis tool provided for informational and educational purposes. It is not investment advice, a personalised recommendation, or an inducement to place an order. The screenshots illustrate what the tool displays and do not predict future results. Trading carries a substantial risk of capital loss.